
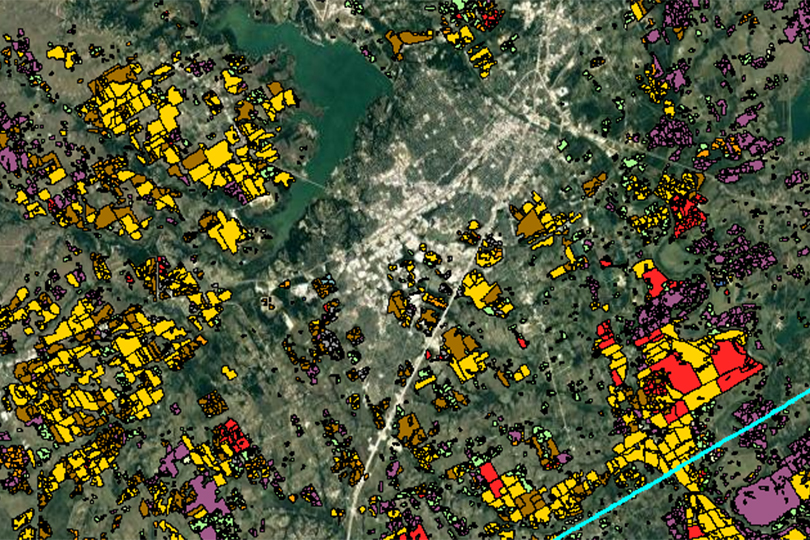
The U.S. Department of Agriculture (USDA) unveiled a geospatial product called Crop Sequence Boundaries (CSB) that offers public access to national-scale visual crop rotation data for the first time.
The new tool was developed by USDA’s National Agricultural Statistics Service (NASS) and Economic Research Service (ERS), two of the department’s statistical scientific research agencies.
CSB is a cutting-edge map of agricultural fields that provides crop acreage estimates and historical planting decisions across the contiguous United States. The open-source product uses satellite imagery and other public data to allow users to analyze planted U.S. commodities, enhancing not only agricultural science and research, but providing farmers a resource to help make farming decisions.
“CSB gives farmers a chance to look at area farmland and see how remote sensing is capturing planting decisions,” NASS Administrator Hubert Hamer said. “Farmers will be able to use eight years of historical crop rotations to enhance their farm records or look at the management history of land that they might have recently started operating. They can also look at how their planting decisions compare in their regions.”
New farmers or farmers considering renting land could also use CSB to decide which crop to plant based on past rotations, such as corn to soy, and researchers can conduct analyses at the field level, such as studying conservation practices for a particular field.
According to USDA, the tool fills a gap between existing data sources, offering a more comprehensive picture and data in one place that is not provided by most other field level products.
The geospatial product incorporates technological advances in satellite imagery and high-performance cloud computing with Google Earth Engine. It is one of several tools that NASS and its partners have developed over the years to support agricultural analyses and to make data more accessible and valuable to the public.
Kevin Hunt, a senior geographer at NASS, said having a representative field to predict crop planting and acreage for the upcoming season based on common historical crop rotations is beneficial as a supplement to producer-supplied data. ERS Economist Maria Bowman noted that ERS is using the product to study changes in farm management practices, such as tillage or cover cropping, over time. This will help USDA agencies understand the impacts of conservation programs that provide financial support for these practices.
This product represents an automated and repeatable method for estimating fields from public data.
“For researchers, CSB is useful because many farm decisions are made at the field level,” ERS Administrator Dr. Spiro Stefanou said. “CSB represents an advancement in agricultural research by using high performance cloud computing to promote competitiveness by making information on planting decisions more accessible to everyone.”
The CSB data sets for 2015 to 2022 are available for download and can be viewed at the state and county-level using an interactive map.
This new tool supports strategies outlined in USDA’s recently released Science and Research Strategy, including improving and expanding new tools for understanding crop production to supplement other USDA spatial tools like COMET – Planner Global.
For NASS data and access to CSB and other geospatial resources, visit www.nass.usda.gov.