
Farmers, ranchers and other agricultural data users have a new way to access and analyze statistics from the U.S. Department of Agriculture (USDA).
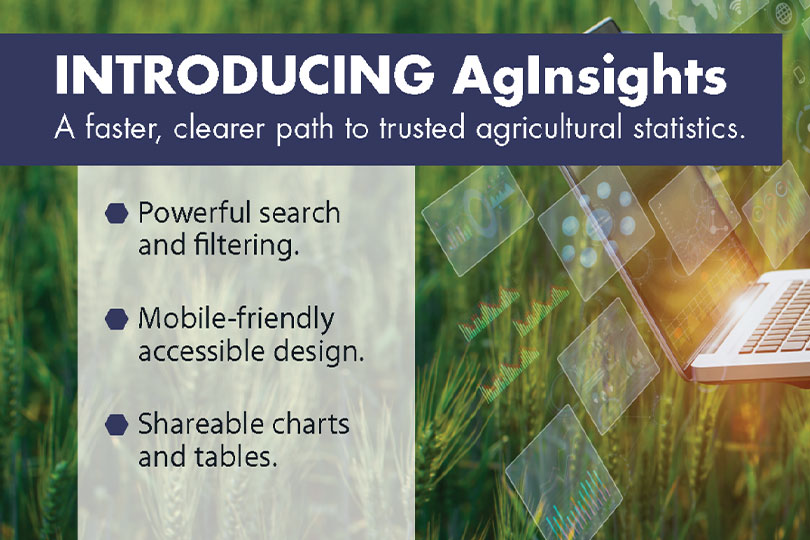
USDA’s National Agricultural Statistics Service (NASS) launched AgInsights, a web-based tool that combines agricultural data, charts and maps in one interactive platform.
Agency officials said the tool is designed to make NASS data easier to navigate, compare and use.
“AgInsights is an important step forward in how producers interact with agricultural statistics. By streamlining information delivery and integrating advanced technologies, we’re making it easier for producers to access, analyze, and apply the latest data to their operations,” NASS Administrator Joseph Parsons said.
AgInsights uses data from NASS Quick Stats, the agency’s searchable database of agricultural statistics. Users can sort and filter information and explore interactive charts and maps. The platform also includes tabular data similar to traditional NASS reports but allows users to more easily analyze and compare the information.
The tool is optimized for mobile devices and includes time-series charts and maps that update as users explore individual reports.
NASS developed AgInsights with feedback from an initial group of agricultural data users. Their recommendations helped shape the platform and its features for users across different commodity sectors.
The agency said AgInsights also will help modernize how it publishes agricultural statistics. The new platform is designed to automate more of the data visualization process and eventually allow NASS to retire some older applications that are costly or difficult to support.
NASS publishes hundreds of reports and datasets covering crop and livestock production, prices, farm economics and other areas of U.S. agriculture.
More information and NASS agricultural data are available through nass.usda.gov.
Leave A Comment