
By Jennifer Dorsett
Field Editor
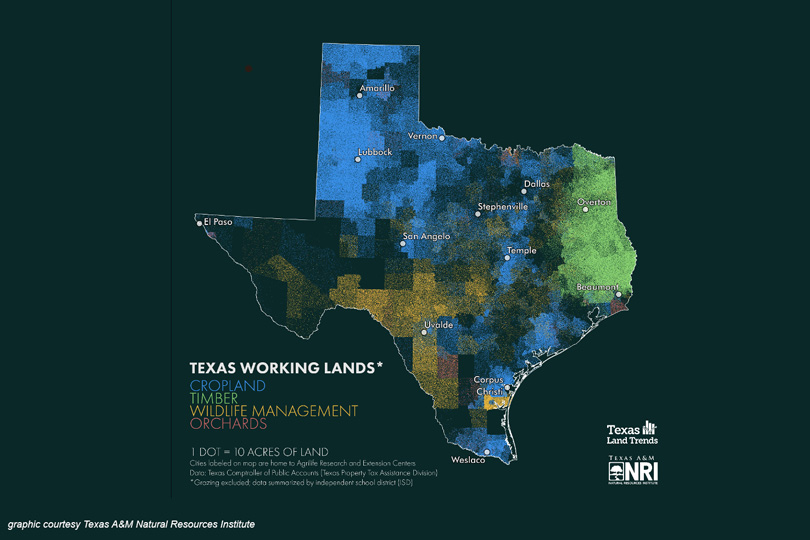
A collection of maps created by the Texas A&M Natural Resources Institute (NRI) showcases the hardworking farmers and ranchers of Texas and the diversity of lands that support them.
The maps are a visual representation of the variety of climates and agricultural activities taking place across the Lone Star State, according to Alison Lund, NRI program coordinator and one of the creators of the images.
“The state’s working lands are used for crops, timber, wildlife management, orchards, livestock and more,” Lund said. “You can now see the variety of agricultural industries statewide and that some areas have two or three of them and that these industries complement one another as opposed to competing with one another.”
The maps use a series of colored dots to represent every 10 acres of rural land being used in a specific agricultural sector. Cropland, timber, wildlife management and orchards are scattered throughout Texas at varying densities depending on the climate and landscape of the area.
The map data was collected, in part, using data from agricultural tax valuation appraisals, said NRI Geospatial Specialist Garrett Powers.
He noted the resulting visuals show the influence of each region’s natural resources on agriculture, such as increased timber production in East Texas and a higher density of cropland in the northern and central parts of the state.
“These examples show how working lands are generating money and how the agricultural industry focus changes over the space of Texas,” Powers said.
More detailed information about agricultural production in Texas, as well as a brief synopsis on programs and areas of study at each of the 13 Texas A&M AgriLife Research and Extension centers located across the state, is available here.